Les KPIs (Key Performance Indicators) sont les incontournables pour bien mesurer et booster les performances et le retour sur investissement de vos actions marketing et commerciales. Bien les choisir, c’est s’assurer de mesurer les données nécessaires à l’aboutissement de vos objectifs… On a voulu vous en faire un best-of, les prenez-vous tous bien en compte dans vos analyses ?
1. Taux d'acquisition
Cet indicateur est celui qui vous permet de connaître les retombées de vos actions marketing et communication et donc, leur efficacité dans l’apport de nouveaux clients.
Vous obtenez ce taux en divisant votre budget alloué à la communication par le nombre de clients acquis sur une période donnée.
2. Coût par lead
Souvent utilisé pour les campagnes marketing sur Internet, cet indicateur se calcule en divisant le total des dépenses engagées dans la génération de leads, par le nombre de leads générés sur une période donnée. Une fois que vous savez combien vous coûte un lead, vous pouvez cibler au mieux vos prochaines campagnes, ou améliorer votre stratégie marketing.
3. Taux de transformation
C’est le taux de personnes ayant réalisé une action (remplissage d’un formulaire de contact, réalisation d’un achat, création d’un compte ou encore téléchargement d’un livre blanc, etc.) comparé au nombre d’individus ayant visité le site internet.
Le taux de transformation peut varier énormément d’un site à un autre en fonction de sa construction, son audience et de son type, c’est pourquoi vous pouvez l’améliorer en donnant simplement envie au visiteur ! Vous pouvez par exemple travailler vos contenus, vos offres (parrainage, programme de fidélité…) et l’UX design de votre site !

4. Taux de rebond
Aïe ! Celui-ci peut faire mal ! A l’instar du taux de transformation (que vous pouvez améliorer avec du contenu et de l’UX design), le taux de rebond peut aussi être impacté par ces mêmes critères. En effet, il s’agit du pourcentage de visiteurs n’ayant visité qu’une seule page avant de quitter votre site, sans en consulter d’autres. Il faut donc que celui-ci soit le plus bas possible ! Cet indicateur vous aidera à jauger la qualité de votre trafic ainsi que votre stratégie d’acquisition.
5. Le panier moyen
Celui-ci est le grand classique des KPIs commerciaux ! Il permet de jauger l’évolution du chiffre d’affaires de votre entreprise, que vous ayez une boutique ou un site de E-commerce. Il s’agit de la dépense moyenne par acheteur, que vous pouvez mesurer dans l’objectif de l’augmenter, grâce à des techniques de ventes additionnelles par exemple ! Vous pouvez calculer cet indicateur simplement en divisant votre chiffre d’affaires par le nombre de vos commandes, sur une période donnée !
6. La durée de vie d'un client
Cette mesure s’obtient en divisant l’entier 1 par le taux d’attrition ou de « churn » (voir KPI n°8 !).
Par exemple, pour une entreprise ayant un taux de churn de 25% : 1 / 0,25 = 4.
En moyenne, un client reste 4 ans dans cette entreprise.

7. NPS (Net Promoter Score)
Le bouche-à-oreille est l’un des moyens de communication les plus efficaces ! A défaut de connaître les personnes qui vont chaudement recommander vos produits ou services à leurs proches, vous pouvez au moins vous faire une idée de la part de clients susceptibles de le faire (ou non) !
Pour cela, il suffit juste de soustraire le taux de promoteurs au taux de détracteurs !
8. Taux d'attrition (ou churn)
Imaginez une baignoire qui se remplit d’eau, mais vous avez oublié de la boucher ! C’est une métaphore qui explique parfaitement le taux d’attrition. C’est super d’attirer de nouveaux prospects et clients, c’est encore mieux de les garder ! Vous pouvez connaître ce taux en divisant le nombre de clients perdus par le nombre total de clients sur une période donnée.
9. La compétitivité
En général, on parle de Benchmark lorsqu’il s’agit de comparer ses performances avec celles d’autres entreprises. Sauf que le benchmark nécessite de répondre à une étude très précise sur un laps de temps, pour ensuite récupérer et traiter les données en question. Dans un premier temps, vous pouvez comparer la performance de votre entreprise avec celle de vos concurrents :
- L’évaluation du chiffre d’affaires,
- La part de marché,
- Le rapport qualité / prix,
- La satisfaction client.
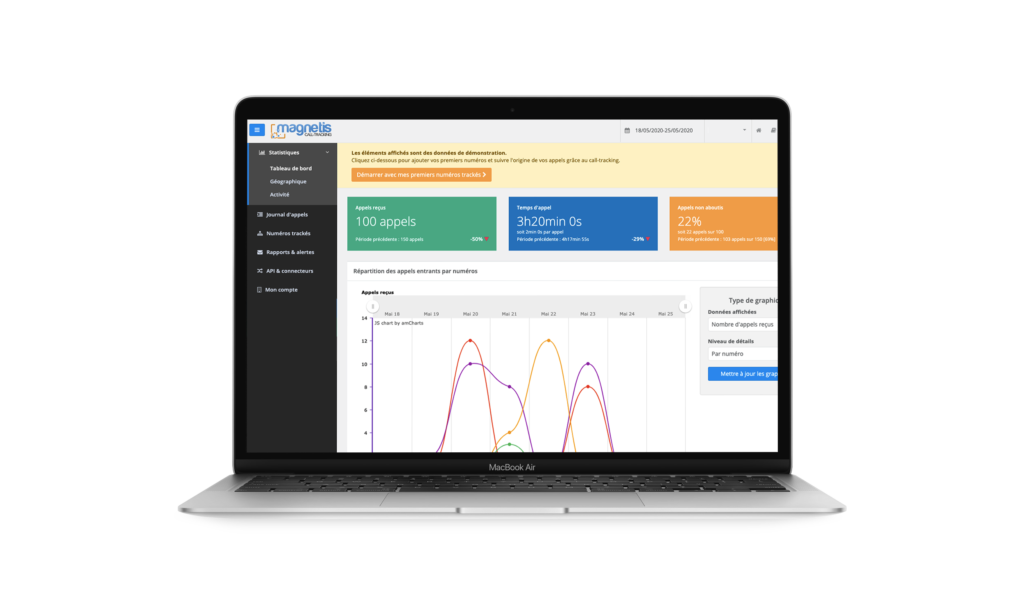
10. Le taux d'appels manqués
On vous a gardé le meilleur pour la fin ! Les entreprises s’évertuent à analyser la moindre donnée sur Internet. C’est normal, puisque Google Analytics délivre un maximum d’informations sur leurs visiteurs ou utilisateurs ! Mais pensez-vous à tous ces clients et prospects qui appellent au lieu de visiter le site Internet ? Pourtant le téléphone est toujours autant utilisé pour avoir une information rapide, une réponse à plusieurs interrogations bien précises, voire une réservation !
Ne laissez plus cette mine d’or de côté et essayez gratuitement notre interface de Call-tracking !